
How to Improve Crop Yield: 12 Proven Techniques for Higher Farm Productivity
How to Improve Crop Yield: 12 Proven Techniques for Higher Farm Productivity
Yield gaps of 20–50% between current farmer yields and agro-climatic potential are common across major cereals when best-management trials are compared to typical field performance, according to Reynolds et al. in Frontiers in Plant Science. That gap is not bad luck. It is the compounding result of dozens of small decisions made on soil that was never tested, varieties chosen from a dealer brochure, water delivered on a calendar, and pesticides sprayed after damage is already visible from the road.
This guide breaks down how to improve crop yield using 12 levers ranked by ROI, sequencing soil and water fundamentals before precision technology investments. The order matters. Most vendor-driven content frames yield improvement as a hardware problem solved by buying the latest sensor or guidance system. The agronomic reality is the opposite: getting soil, water, and genetics right typically delivers more yield per dollar than another layer of tech bolted onto a depleted system. Project Drawdown identifies closing yield gaps with existing technologies as one of the highest-leverage food-security strategies available — and that closure happens through management, not novelty.
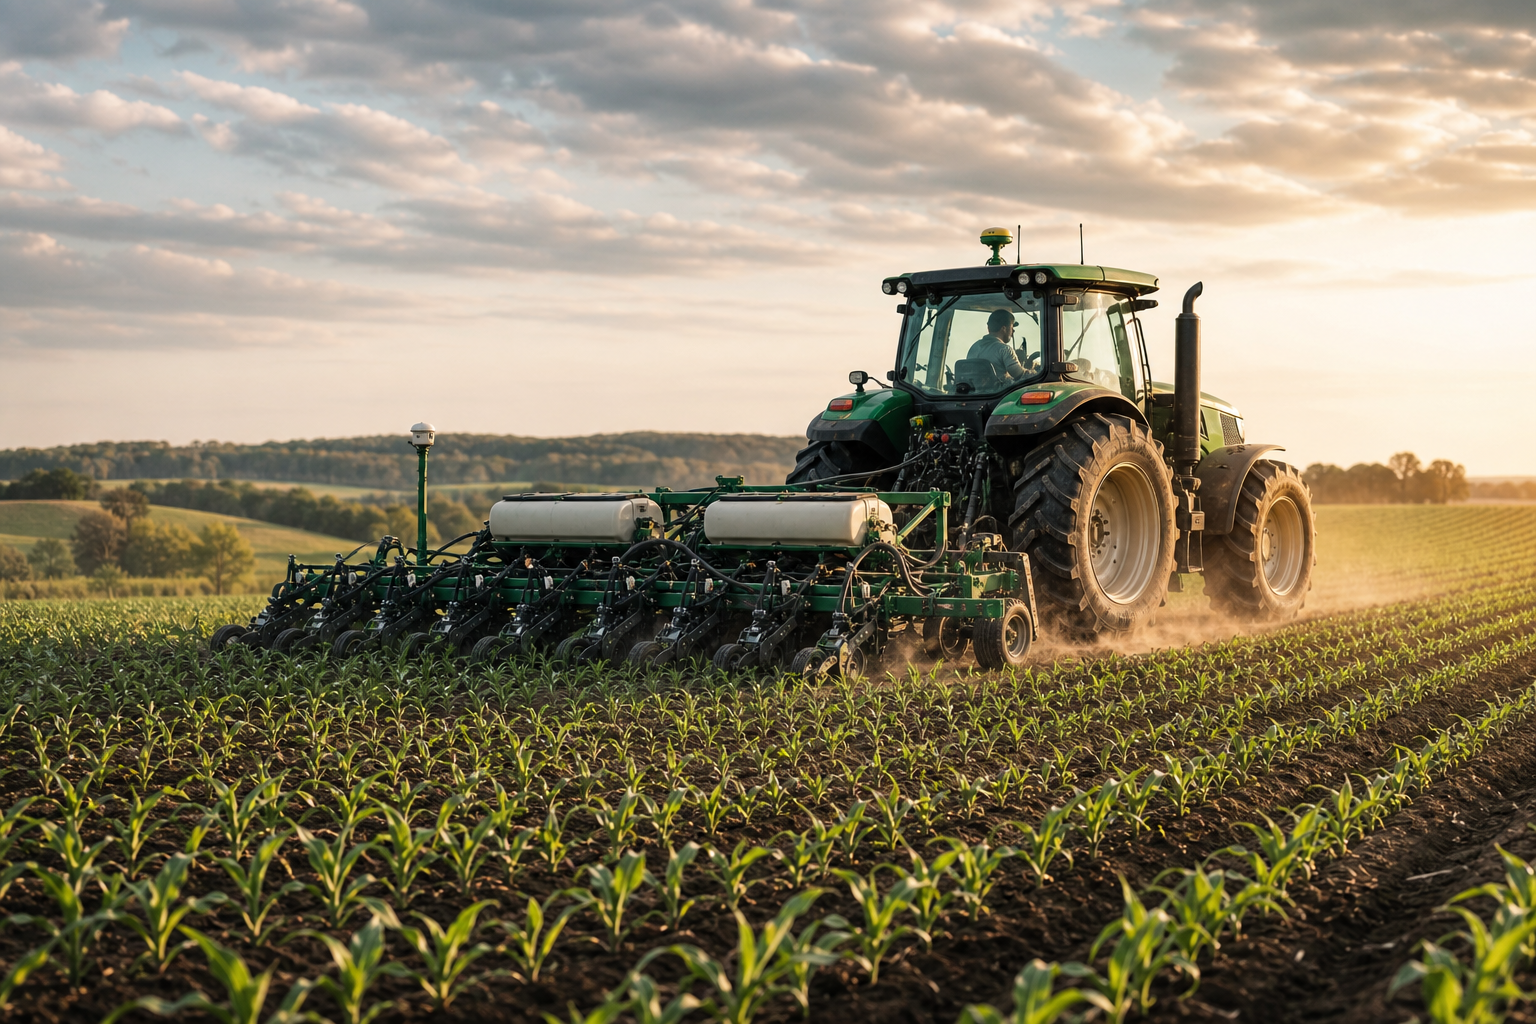
Table of Contents
- The Three Foundation Pillars That Determine Whether Any Yield Technique Will Work
- Soil Testing and Nutrient Management — Moving From Habit-Based to Data-Driven Fertilization
- Plant Population and Precision Seeding — Where Singulation Beats Seed Count
- Irrigation Timing, Soil Moisture Sensing, and the Deficit-Irrigation Lever
- Integrated Pest, Disease, and Weed Management — Scouting Protocols That Prevent Yield Loss
- Precision Agriculture Technology — Which Tools Pay Back and Which Are Premature
- The 12-Point Pre-Season and In-Season Yield Audit
- FAQ
The Three Foundation Pillars That Determine Whether Any Yield Technique Will Work
Before you select any of the 12 techniques in this guide, identify which of three foundation pillars is your current bottleneck. Apply a yield technique to the wrong pillar and you waste capital. Apply it to the right one and the return compounds across every other practice on the farm.
Pillar 1 — Soil Fertility and Structure (the non-negotiable baseline). Soil scientist Dr. Pedro A. Sanchez (World Food Prize Laureate) and broader extension agronomy literature consistently identify soil fertility and organic matter as the first yield-limiting factor. Without fixing soil constraints, investments in improved seed, irrigation, or pesticides have limited payoff. According to the Deer Creek Seed agronomy guide [VENDOR SOURCE], poor soil conditions create stress that limits yields regardless of other management. Practically, "good soil" means adequate organic matter (typically 3%+ for row-crop ground), pH matched to crop (neutral to slightly acidic for most cereals), an active microbial population, and no compaction layer in the top 12 inches.
Pillar 2 — Water Availability and Timing. Water stress during critical reproductive stages cuts yield far more than total seasonal rainfall deficits would suggest. One week of moisture stress at corn silking does more damage than a month of mild stress during vegetative growth. Growth-stage-based scheduling outperforms calendar-based irrigation, according to guidance from FpoGrow [VENDOR SOURCE] and Brandon Bioscience [VENDOR SOURCE]. The pillar question to ask yourself: can you deliver the right amount of water at the right stage, or are you irrigating on a calendar?
Pillar 3 — Genetics Matched to Environment. Genetic gains must be matched by management to be realized. Varieties with high yield potential underperform when planted into environments their breeding did not optimize for. Reynolds et al. identify canopy photosynthesis, biomass partitioning, and stress tolerance as the traits that determine variety×environment fit. A variety bred for high-rainfall ground does not magically tolerate drought because the seed bag was expensive.
The diagnostic test. Three quick questions identify which pillar is your bottleneck:
- When was your last full soil test, and did you act on the recommendations?
- Can you point to a specific growth stage in last season where water stress occurred?
- Did your variety selection this year follow yield-by-zone data, or seed-dealer recommendation?
If the answer to any is "no" or "don't know," that pillar is your current limit. Variety selection logic differs dramatically between commercial cash-crop systems and subsistence-crop systems where farmers grow primarily for household consumption, and the diagnostic still applies in both contexts — the bottleneck just shows up at different scales of loss.
The sections that follow address each pillar in depth. Soil and nutrients first. Population and seeding next. Irrigation timing after that. Then pest pressure, then technology, then the operational audit that ties everything together. The order is deliberate.
Precision technology applied to depleted soil is premium fuel poured into a clogged engine — the system cannot deliver what the inputs promise.
Soil Testing and Nutrient Management — Moving From Habit-Based to Data-Driven Fertilization
Fertilizer is typically the second-largest input cost after seed, and blanket applications based on historical habit leave both yield and cash on the table. Data-driven nutrient management — soil tests, tissue tests, split applications, and zone-specific rates — consistently outperforms a single average rate applied uniformly across the field, according to FpoGrow and Folio3 Agtech [VENDOR SOURCES]. The checklist below is the operational version.
- Sample at the right frequency. Every 2–3 years for row crops, annually for high-value horticultural crops. Composite sample from 8–10 cores per management zone at 6–8 inch depth, per Deer Creek Seed [VENDOR SOURCE]. Single grab samples from the easy corner of the field produce numbers, not information.
- Test the full panel, not just NPK. Request pH, organic matter, macronutrients (N, P, K), secondary nutrients (Ca, Mg, S), and micronutrients where deficiencies are suspected (Zn, B, Mn, Fe). FpoGrow's nutrient management guidance is explicit on this point — micronutrient gaps cap yield in ways an NPK-only panel cannot detect.
- Add in-season tissue testing. Sample at defined growth stages (V6 in corn, R1 in soybean) to verify the plant is actually pulling what the soil contains. Tissue tests catch availability problems that soil tests cannot predict — compaction, cold soils, root damage from insects, or pH drift in the root zone.
- Apply by zone, not field average. If yield maps from prior seasons show variability, build management zones and apply nutrient rates per zone. Blanket applications over-fertilize productive ground (wasting money) and under-fertilize problem ground (wasting yield).
- Split nitrogen across the season. Move from a single pre-plant N pass to split applications (pre-plant + side-dress + late-season foliar where appropriate) or slow-release products. Splitting synchronizes supply with crop demand and reduces leaching loss, a point both Deer Creek Seed and FpoGrow emphasize. Single-shot pre-plant N is a legacy practice that loses nitrogen to weather between application and uptake.
- Track and reconcile. Record application rates, dates, and product. At season end, overlay yield data against application maps to identify response curves for next year's plan. Without reconciliation, you repeat last year's mistakes with no diagnostic feedback.
The counter-intuitive economic point: data-driven nutrient management often reduces total fertilizer spend while raising yield. Waste from over-application on unresponsive ground frees budget for targeted micronutrient correction where the soil is actually limited. The farm that tests and zones spends less per acre on fertilizer and harvests more bushels — the opposite of what a "more inputs equals more yield" instinct predicts. Legumes integrated into rotation supply nitrogen and humus, reducing synthetic N requirements in subsequent cereal crops, according to a University of Maryland Extension cover crops bulletin. That rotation effect is a free input — earned by sequencing, not purchased.
Plant Population and Precision Seeding — Where Singulation Beats Seed Count
Uniform spacing matters more than total seed count. Plants that emerge within 48 hours of each other and at consistent spacing compete on equal footing. Late emergers and doubled plants become weeds against their faster neighbors — they consume light, water, and nutrients without contributing proportional yield. Two seeds in the same hole produce less than two evenly spaced plants. This is why singulation — the seeder's ability to drop exactly one seed at exactly the right interval — is the metric to optimize, not just bag rate per acre.
| Crop | Typical Population Range | Spacing Sensitivity | Singulation Target | Common Calibration Failure |
|---|---|---|---|---|
| Corn (field) | 30,000–36,000/acre | Very high | ≥99% singulation | Worn meter discs causing doubles |
| Soybean | 100,000–140,000/acre | Low–moderate | ≥97% singulation | Seed bridging in dry conditions |
| Wheat (drilled) | 1.2–1.6M/acre | Low | N/A (drill not singulating) | Uneven depth from worn openers |
| Canola | 400,000–600,000/acre | Moderate | ≥95% singulation | Small seed metering inaccuracy |
| Cotton | 38,000–55,000/acre | High | ≥98% singulation | Vacuum pressure drift |
Population ranges above are typical regional benchmarks drawn from extension and seed-company variety guides. Confirm with your local extension office or seed dealer for the variety×environment combination on your specific fields. These are not universal optima.
Three causes of population loss between seed bag and final stand:
Singulation failure. Worn meters, incorrect vacuum pressure for seed size, or the wrong meter disc for the crop produce skips (under-population) and doubles (resource competition). Pre-season meter testing on a stationary test stand identifies failures before they hit the field. The test takes an afternoon. The yield cost of skipping it lasts the whole season.
Depth and seed-to-soil contact. Worn openers, incorrect down-pressure, and high speed all reduce uniform emergence. FpoGrow and Folio3 Agtech both flag depth control as a precision-seeding fundamental that gets overlooked in favor of flashier upgrades. Speed kills emergence uniformity more than any other variable a farmer controls voluntarily.
Pass-to-pass overlap. Without GPS guidance, manual steering produces 4–10% overlap, which translates to wasted seed in headlands and double-planted strips that yield below single-pass ground. RTK GPS autosteer brings pass-to-pass error below 2 inches consistently. The seed-cost savings and uniform stand benefit compound across every pass — seeding, spraying, fertilizing, and tillage — over the whole field, an effect Deer Creek Seed describes as leveraging technology against operator fatigue.
The practical sequence: calibrate meters pre-season, verify population with post-emergence stand counts at V2 in corn or VC in soybeans, and overlay stand-count gaps against guidance logs to identify whether the gap is mechanical (the seeder failed) or operator (steering error or speed). Without the overlay, you are guessing at the cause and probably blaming the wrong component.

Irrigation Timing, Soil Moisture Sensing, and the Deficit-Irrigation Lever
Most water-related yield loss is timing failure, not volume failure. A field that received adequate total seasonal water can still lose 30% of its yield potential if the water arrived during vegetative growth and was unavailable during reproductive stages. Growth-stage-based scheduling consistently outperforms calendar-based irrigation, per FpoGrow and Brandon Bioscience.
Critical growth stages where water stress causes disproportionate yield loss:
- Corn: tasseling through R2 (blister). One week of moisture stress here does more damage than a month of stress during vegetative stages. Standard extension agronomy guidance treats this window as the single highest-priority irrigation target.
- Soybean: R3–R5, pod development through full pod fill. Stress here directly limits seeds per pod and seed size.
- Wheat: boot through grain fill. Late stress reduces test weight before it reduces head count.
- Cotton: first bloom through peak bloom. Boll retention drops sharply under stress at this window.
Monitoring tools in plain language:
- Capacitive soil moisture sensors. Permanent or semi-permanent probes at multiple depths (typically 6", 12", 24") report volumetric water content. Best for fields with installed infrastructure and the ability to act on the data. These probes are a core component of broader IoT devices used in precision agriculture, where in-field telemetry feeds directly into irrigation decisions.
- Tensiometers. Measure soil suction. Cheap and reliable for shallow-rooted high-value crops, less practical for deep-rooted row crops on large acreage.
- Evapotranspiration (ET) models. Combine weather station data with crop coefficients to predict daily water use. Works without in-field sensors but requires accurate local weather data — not the regional airport forecast.
Deficit irrigation as a deliberate strategy:
- Planned mild stress during vegetative stages drives deeper root development.
- Avoid stress entirely at reproductive stages, where the yield penalty is steep and non-recoverable.
- Saves water and energy without proportional yield loss when scheduled around growth stages rather than imposed indiscriminately.
System efficiency comparison. Flood irrigation: high labor, high water loss to evaporation and runoff, uneven distribution down the field length. Drip with fertigation: water delivered directly to the root zone, dissolved nutrients matched to crop demand, the highest efficiency configuration available, per Brandon Bioscience and Akshar Farmtech [VENDOR SOURCE]. Center pivot sprinkler: middle ground — good coverage on large fields with moderate efficiency, the workhorse of most irrigated row-crop ground.
Drainage and salinity. Drainage problems and salinity buildup in irrigated systems silently cap yield in low spots and downslope ground. The plant looks fine until reproductive stage, then collapses. Yield maps from prior seasons reveal these zones reliably — they show up as persistent low-yield patches that do not move year to year. Tile drainage on the wet zones and zone-specific irrigation rates on the saline zones reduce the loss without changing anything about the rest of the field.
One week of water stress at silking erases two months of careful nitrogen management. Timing is the yield lever; volume is the bill.
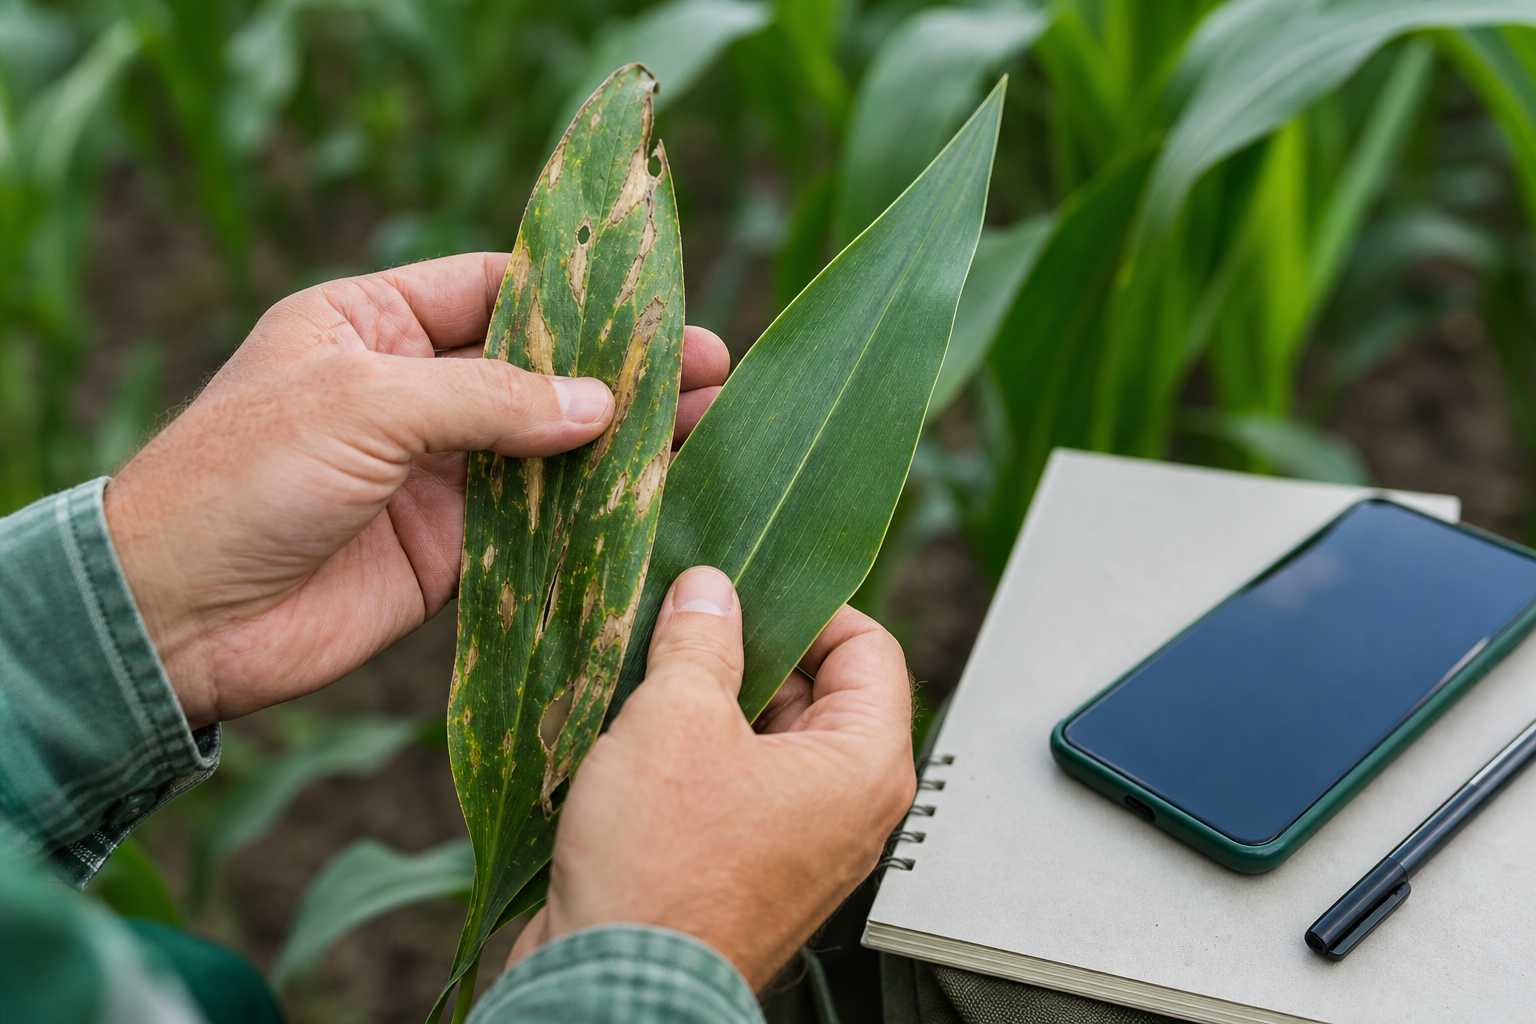
Integrated Pest, Disease, and Weed Management — Scouting Protocols That Prevent Yield Loss
Reactive spraying after damage is visible from the road is the most expensive way to manage pests. By the time you can see the damage from a moving truck, the yield loss is already in the field — chemistry cannot reverse it. Integrated Pest Management (IPM) is a baseline framework, not an advanced technique. Regular scouting, economic thresholds, and mode-of-action rotation are the three pillars, per FpoGrow, Deer Creek Seed, and Folio3 Agtech.
| Threat Category | Pre-Plant Window | Early Vegetative (V2–V6) | Reproductive Stage | Late-Season / Fill |
|---|---|---|---|---|
| Soil insects (wireworms, grubs) | Scout residue; seed treatment decision | Stand-count gaps trigger investigation | Low priority | Low priority |
| Foliar insects (armyworm, aphids) | Field history review | Threshold scouting weekly | High-impact window | Salvage spray rarely justified |
| Foliar disease (rust, Fusarium, NLB) | Variety selection by resistance rating | Scout for first lesions | Fungicide if threshold met | Disease established — limited ROI |
| Weeds (Palmer amaranth, waterhemp) | Burndown + residual herbicide | Post-emerge before 4" height | Canopy closure limits options | Harvest-aid only |
| Resistance management | Plan MOA rotation | Confirm rotation in tank | Rotate from prior pass | Document for next year |
Three operational points the table does not fully convey:
Scouting frequency and discipline. Weekly walks through the field during the growing season, with documented counts and locations — not windshield assessments from the pickup. Drone imagery flags hotspots and tells the scout where to walk, but it does not replace boots-on-ground identification. A stressed plant looks the same from above whether the cause is disease, nutrient deficiency, or compaction. NDVI tells you something is wrong. It does not tell you what.
Economic threshold vs. visible damage. The economic threshold is the pest population at which the cost of treatment equals the expected yield loss without treatment. Spraying below threshold loses money on chemical and application. Spraying above threshold every day of delay loses more yield. Knowing the threshold for each likely pest on each crop is non-negotiable IPM literacy.
Resistance management as long-term yield protection. Continuous use of the same herbicide or fungicide mode of action selects for resistant populations. Palmer amaranth resistance to glyphosate is the textbook cautionary tale — once resistance is established field-wide, the herbicide is permanently devalued for that field. Mode-of-action rotation, tank-mixing, and integration with cultural controls (cover crops, rotation, narrow row spacing for early canopy closure) protect the chemical toolbox for the next decade of farming.
A counter-evidence note. Vendor-leaning sources sometimes overemphasize "timely crop protection" via inputs over ecosystem approaches. Continuous chemical reliance shows documented diminishing returns from resistance buildup, environmental contamination, and beneficial-insect suppression that increases secondary pest pressure. The strongest IPM programs treat chemistry as the last lever after cultural controls and biological diversity have done their work — not the first lever pulled at the first sign of a pest.
Precision Agriculture Technology — Which Tools Pay Back and Which Are Premature
Technology budgets are finite. Vendor messaging treats every tool as essential. The agronomic reality is that ROI depends on field-specific gaps. This section prioritizes by payback timeline, not novelty. Project Drawdown frames closing yield gaps with existing technology as the high-leverage strategy; Folio3 Agtech describes precision practices as multipliers on solid agronomy, not substitutes for it.
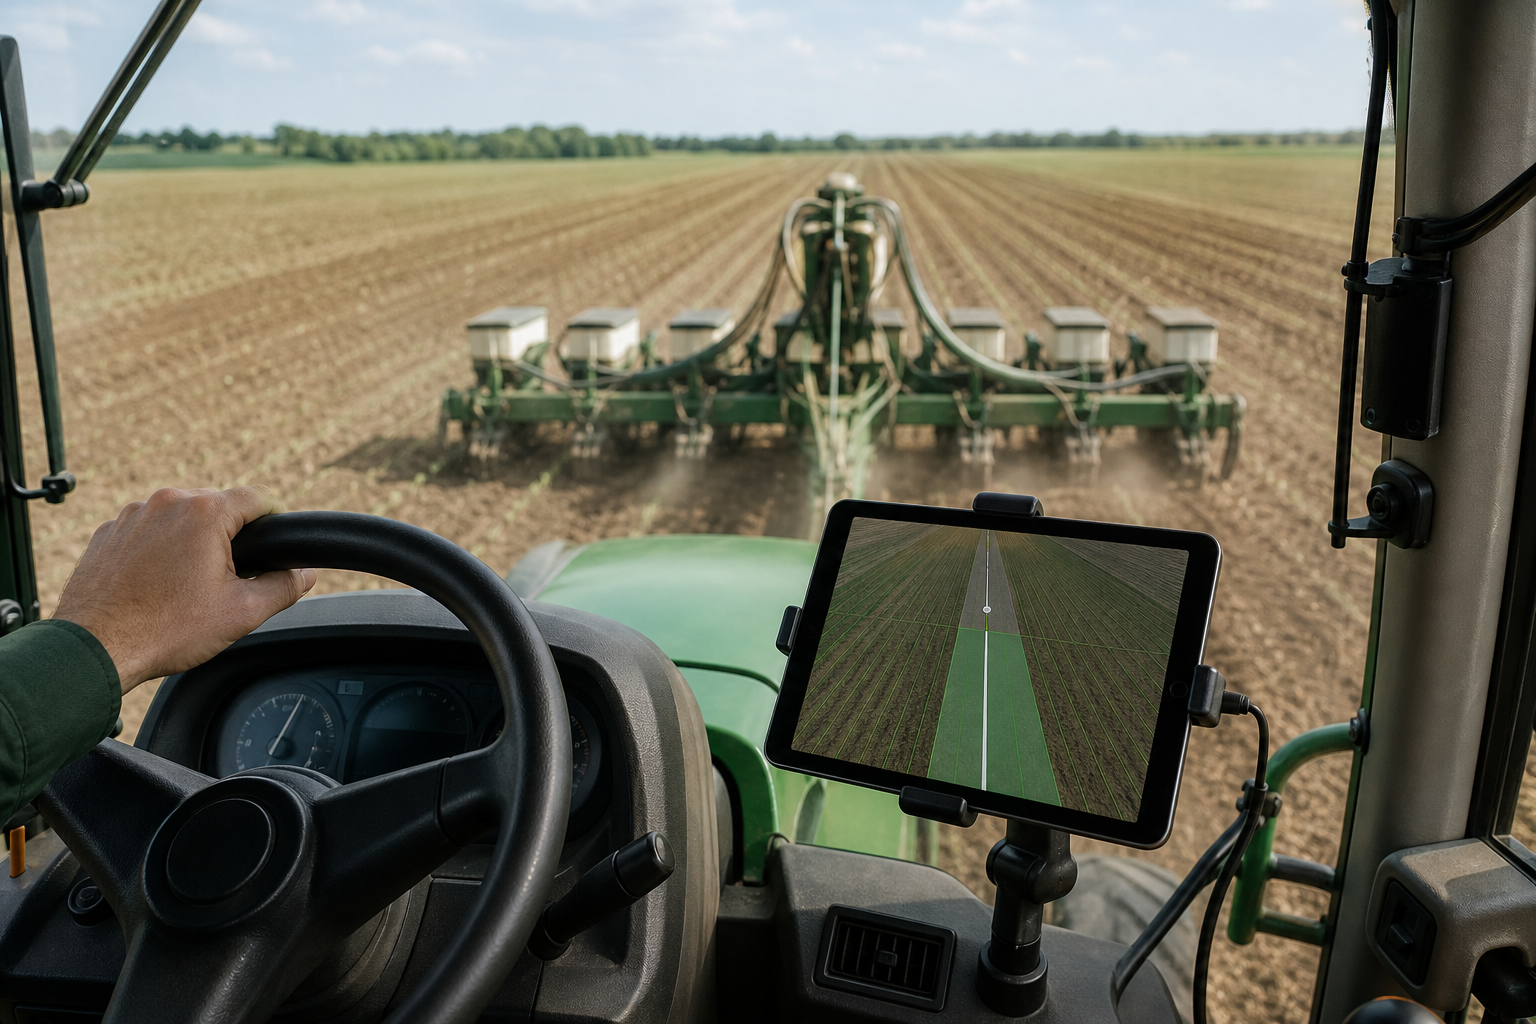
- RTK GPS Autosteer — Highest near-term ROI for most operations. Sub-2-inch pass-to-pass accuracy reduces overlap waste on every input pass: seeding, spraying, fertilizer, tillage. Payback comes primarily through seed and chemical savings on operations of 500+ acres, plus reduced operator fatigue that extends usable workdays in tight planting and spraying windows. The compounding effect across every pass over a season is what drives the payback — not a single dramatic yield jump. Particularly relevant for farmers running steer-ready tractors who can install affordable open-platform systems without proprietary lock-in.
- Yield Monitors — Essential baseline, not optional. Without yield data overlaid on field maps, every other precision-ag investment operates blind. Calibration must be performed at the start of each crop's harvest and rechecked when grain moisture changes significantly. Both Deer Creek Seed and FpoGrow treat yield monitoring as table stakes for data-driven farming — the input that makes every other data-driven decision possible.
- Variable-Rate Technology (VRT) — ROI only on high-variability fields. VRT pays back when within-field variability is large enough that zone-specific rates meaningfully outperform a single average rate. On uniform fields, the equipment investment, prescription-writing time, and software subscription exceed the input savings. Diagnose with yield maps before investing. This is where vendor narratives diverge most sharply from agronomic reality.
- Drone and Satellite Imagery — Diagnostic, not prescriptive. Useful for flagging stress zones mid-season so scouts know where to walk. Not a replacement for ground-truthing. Multispectral imagery (NDVI) identifies vigor differences but does not diagnose cause. Integration with a connected sensor network turns imagery into action by combining it with soil moisture, weather station, and equipment telemetry data — context that turns a vigor map into an action plan.
- Farm Management Software and Data Platforms — Multi-year compounding value. Single-season ROI is modest. Multi-year value comes from variety-by-zone performance tracking, input response curves built from history, and decision support that improves with data accumulation. The key question is whether the platform standardizes data across equipment brands or locks you into one vendor's ecosystem. Emerging tools — including augmented reality applications in modern farming for in-field visualization — extend the value of accumulated farm data into the cab and the field.
Sequence matters. The recommended adoption order for most operations: (1) yield monitor with reliable calibration; (2) RTK GPS autosteer for input precision across every pass; (3) field management software that ingests yield and application data; (4) drone or imagery for in-season scouting support; (5) VRT only after 2–3 years of yield data confirm variability worth managing. Skipping ahead — buying VRT before you have multi-year yield maps, or buying drones before you have a yield monitor — produces expensive data nobody uses.
The open-platform question deserves its own paragraph. Closed-ecosystem precision systems lock the farmer into one vendor's hardware, software, and data formats. Open platforms — such as AgOpenGPS-compatible systems with native iOS control — let the farmer mix and match components and own the data outright. The cost difference is significant for small-to-medium operations, often a factor of 3–5x between an open-platform RTK build and a proprietary equivalent. For farms already operating iPads or iPhones, the mobile-first open approach removes the Windows PC dependency that has historically been the friction point in community precision-ag adoption.

Data without a decision is just expense. Adopt technology only when it closes a specific gap between your current practice and your field's potential.
The 12-Point Pre-Season and In-Season Yield Audit
This is the operational tool. Run items 1–9 before planting. Run items 10–12 during the season and post-harvest. Each item is a verifiable action with a documented output — not a vague intention. Document each completion date and result; the file becomes year-over-year decision support that improves on its own as the data accumulates.
- Soil test completed and interpreted by management zone. Sample 8–10 cores per zone, 6–8 inch depth, in the last 24 months. Recommendations translated into a field-specific nutrient plan, not a generic regional rate.
- Variety/hybrid selection matched to soil type, drainage class, and pest pressure. Documented rationale per field, not seed-dealer default. The Reynolds et al. variety×environment framing applies here directly.
- Seeder calibration verified. Meters tested on a stationary stand, depth checked, down-pressure confirmed, vacuum pressure set for the specific seed size of this season's variety.
- Sprayer calibration verified. Nozzle output measured at working pressure, boom height checked, pressure setting matched to target droplet size for the products in this season's plan.
- Nutrient plan finalized with split-application schedule. Pre-plant, side-dress, and any foliar timing committed to calendar with conditional triggers (tissue test result, growth stage, soil moisture).
- Irrigation triggers defined (if irrigated). Soil moisture sensor placement confirmed, ET model subscription active, growth-stage decision points written down — not improvised in-season under pressure.
- IPM scouting schedule and threshold table prepared. Weekly scouting calendar set, economic thresholds for each likely pest documented, mode-of-action rotation logged for resistance management before the first spray.
- GPS guidance and autosteer system field-tested. RTK base station operational, accuracy verified on a known headland, software updated, mounts and antennas inspected for winter damage.
- Yield monitor calibrated for first crop. Initial calibration completed before the first acre of harvest; recalibration schedule set for moisture changes and crop transitions during the season.
- In-season scouting log maintained weekly. Field observations dated and georeferenced, photos archived, threshold triggers documented when crossed — not reconstructed from memory at season end.
- Application records georeferenced and saved. Every fertilizer and chemical pass logged with date, rate, product, and conditions (wind, temperature, soil moisture). This is also the audit trail when neighbors, regulators, or insurance carriers ask.
- Post-harvest yield review by zone. Yield maps overlaid against soil test zones, application maps, and scouting notes. Three highest-loss zones identified and root-caused before next season's plan begins. This step is what converts data accumulation into actual yield improvement — and it is the step most often skipped because it happens after harvest, when fatigue is highest and the next season feels far away.
Run this audit honestly. The items you cannot check off are the items defining your current yield ceiling.
FAQ
What's the realistic ROI timeline for RTK GPS autosteer on a small-to-medium farm?
Payback is driven mainly by input savings from reduced overlap — seed, chemical, fertilizer — compounding across every pass, not by a single yield jump. Most operations of 400+ acres see payback within roughly 2–3 seasons on input savings alone, with operator-fatigue reduction and longer usable workdays in critical planting and spraying windows as secondary benefits. Open-platform systems built on AgOpenGPS-compatible hardware and controlled via iOS shorten payback substantially compared to proprietary alternatives, because the entry hardware cost is a fraction of a major-brand integrated guidance kit. ROI is context-dependent — small irregular fields, very flat ground, or low-acreage operations see longer payback periods.
How do I prioritize yield improvements if my capital budget is tight this season?
Sequence by cost-to-impact ratio. First: soil test if your last one is older than three years — lowest cost, highest diagnostic value, often reveals fertilizer overspend you can redirect. Second: seeder and sprayer calibration — labor only, no capital, immediate effect on input efficiency. Third: scouting discipline — labor only, prevents the most expensive yield losses (uncontrolled pest outbreaks, late herbicide passes). Fourth: variety selection review using whatever yield data you already have. Fifth: defer technology purchases until items one through four are operational. The foundation pillars logic from Section 1 applies — capital spent on tech while soil and calibration gaps persist underperforms capital spent fixing the gaps.
Can I improve yield on dryland/rain-fed systems without irrigation?
Yes, and the levers are well-documented. Cover crops improve moisture retention by building organic matter and reducing surface evaporation. Conservation tillage preserves residue cover that cuts evaporative loss. Variety selection for drought tolerance — matching maturity group and stress-tolerance traits to your historical rainfall pattern — shows up in yield the first season. Planting-date adjustment aligns critical reproductive stages with historical rainfall windows rather than fighting them. The University of Maryland Extension cover crops bulletin documents the soil-moisture and nitrogen benefits of integrated legume cover crops. FpoGrow's broader sustainability section reinforces the rain-fed application.
How long until I see yield gains from changes made this season?
Honest answer: depends on the lever. Soil-test-driven nutrient corrections often show response in year 1 — fixing a clear phosphorus or pH deficiency produces visible difference the same season. Variety changes show in year 1 if the match is right. RTK guidance shows immediate operational benefit on input efficiency, with full yield impact compounding over a few seasons as data accumulates. Cover crops and conservation tillage may show neutral or slightly lower yields in years 1–2 before soil-structure benefits compound — this is the honest counter-evidence that vendor materials downplay. Full system-level yield improvement, where all 12 levers are operating together, typically takes three seasons of integrated practice. The audit in Section 7 is what keeps the three-year project on track instead of dissolving into ad-hoc decisions.