
Exploring Augmented Reality (AR) Applications in Modern Farming
You walked the back ninety last September and saw what you always see in late season — uneven canopy, a yellow patch in the southwest corner, two rows that looked thinner than the rest. By then it was too late to do anything but mark it for next year. Roughly 15% of those acres underperformed, and the post-harvest yield map confirmed what the eyes already suspected. The map did not explain why.
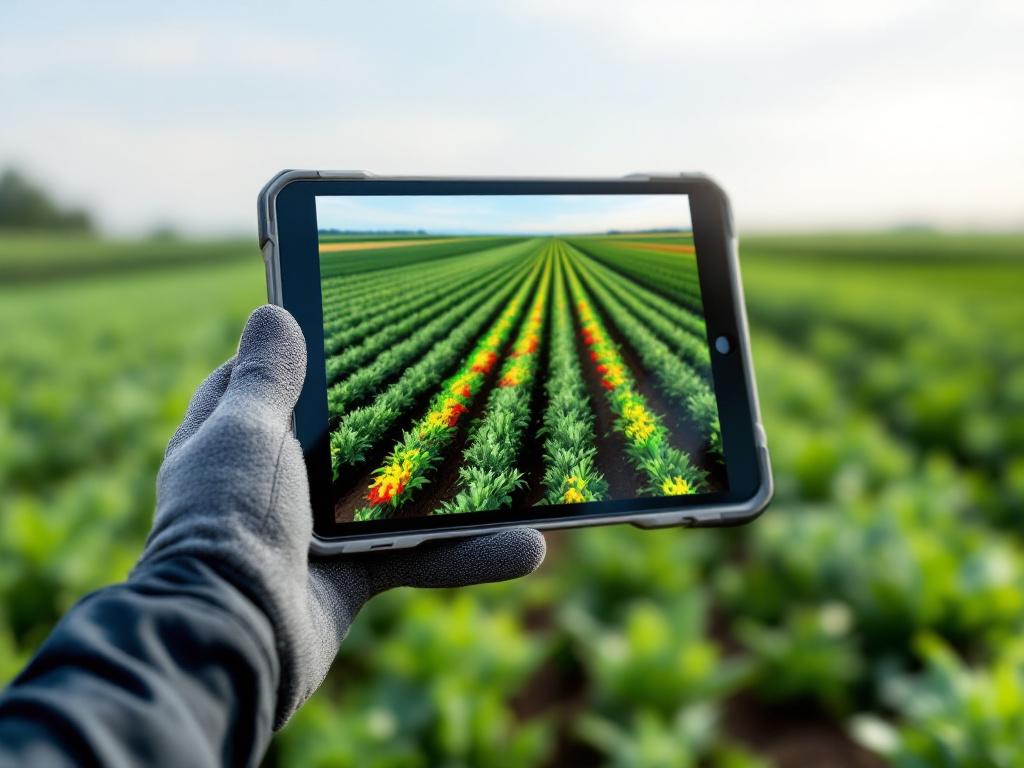
This year you walk the same field with a rugged tablet held at chest height. Augmented reality overlays subsurface moisture bands, nitrogen distribution, equipment pass coverage, and pest hotspots directly onto the live view of the rows in front of you. The yellow patch from last September now has a reason: a compaction layer at 14 inches that the surface never showed. The decision window — narrow, valuable — is open while you are standing on the spot that needs the decision.
This guide explains where AR genuinely closes operational gaps in modern farming, what hardware and data infrastructure it requires, what it costs in attention and connectivity, and how to evaluate whether your operation is ready. AR adoption in agriculture remains early-stage but is accelerating alongside 5G coverage, IoT sensor density, and AI-driven image recognition, according to InsightAce Analytic (vendor-flagged market research). What follows is not futurism. It is an operational read on what farm technology of this category does today, what it does not yet do, and where it is worth your capital.

Table of Contents
- Why Walking the Field No Longer Scales
- What AR Actually Reveals in the Field
- Variable-Rate Application and Equipment Guidance
- Seeing Below the Surface
- Turning One Expert Into Every Operator
- AR Readiness Audit
Why Walking the Field No Longer Scales
The operational blind spot AR closes is not a single failure — it is four overlapping failures of traditional field management, and each one compounds the others as farm size grows.
Visual inspection misses what is invisible. Manual scouting catches symptoms only after they manifest above the canopy. By the time a fungal infection has bronzed enough leaf surface to be visible at walking pace, the spore load has already moved across multiple rows. By the time water stress has visibly curled a soybean leaf, root-zone moisture has been depleted for days. Pest pressure, nutrient deficiency, and water stress are all detectable via sensor data well before farmer-visible symptoms emerge. According to Sparkem Tech (vendor-adjacent), AI image analysis applied to drone or smartphone imagery — referencing FAO research on detection systems — can identify pest issues before they become visible to a walking scout. The eye is a late sensor.
Decision lag between data and action. Even when you have the sensor data, it lives on a dashboard in the office. You walk the field, notice something, walk back to the truck, drive to the office, open the dashboard, cross-reference probe readings, and walk back to the field. The decision cycle measured in hours becomes a cycle measured in seconds when data is overlaid on the live view at the point of decision. Wageningen University Research frames this directly: real-time, in-task data retrieval is what separates effective precision farming systems from data-rich-but-action-poor ones. Most farms today have plenty of data. What they lack is data arriving where the hand is reaching for the tool.
Equipment coordination at scale. Above roughly 200 acres, an operator cannot mentally track which zones have been sprayed, fertilized, or tilled across a multi-pass day. Overlap and skipped patches become inevitable without spatial overlay. The peer-reviewed work archived by PMC/NIH on GPS-guided tractor systems with AR head-mounted displays shows treated vs. untreated zones rendered as color-coded overlays in the operator's field of view. Without that overlay, end-of-row gaps and overlapped passes are discovered post-harvest from the yield map — by which point the input has already been wasted or the patch already underdosed.
Knowledge concentrated in too few people. The senior agronomist or veteran operator who can identify a fungal infection at 20 paces, or who knows by feel when the soil is too wet for tillage, is one person. A 5,000-acre operation with seasonal labor cannot rely on that single point of expertise. Turnover compounds the problem. Each year the new scout repeats the mistakes the previous scout already learned to avoid, because the learning lives in heads, not in systems.
These four failures share a structure. They are not failures of effort, equipment size, or willingness to invest. Bigger sprayers, more probes, additional staff — none of these solve the visibility gap on their own. The gap is between data existing somewhere and data appearing where the decision is being made. That gap is what augmented reality is built to close, and it is the only frame in which AR investment makes economic sense. If your data already arrives at the right place at the right time, you do not need AR. If your data is stranded on a dashboard, in a spreadsheet, or in one person's memory, AR is the most direct bridge from data to action that current farm technology offers.
What AR Actually Reveals in the Field
The clearest way to evaluate AR in agriculture is to look at what gets surfaced and where the data comes from. The four primary data layers below are the ones that change daily decisions, and each is fed by sensors or imagery you may already own.
| Data Layer | Traditional Method | AR-Enabled Method | Data Source |
|---|---|---|---|
| Canopy health | Visual scouting; symptoms visible only after stress is advanced | Multispectral overlay shows stress zones before visible symptoms | Drone/satellite imagery |
| Soil moisture | Surface inspection or single probe readings | Subsurface heatmap across full field on live view | Probe network + sensor fusion |
| Pest pressure | Walk-and-spot inspection | Historical hotspot overlay + AI image flags | Prior-season records + image recognition |
| Nutrient distribution | Lab results returned days after sampling | Color-coded nitrogen/phosphorus zones overlaid on field | Soil sampling + UAV imagery |
| Equipment status | Office dashboard or radio check-in | Tractor location, fuel, application rate visible on field view | Telemetry feed |
Canopy health comes through as a red/yellow/green stress map derived from multispectral imagery from drone or satellite passes. Where traditional scouting gives you a binary "looks fine / looks stressed" judgment at walking pace, the overlay points you to the specific sub-acre zones worth scouting on foot today. The decision changes from "where do I start walking" to "I have three zones flagged, I will check those first."
Soil moisture appears as a subsurface heatmap derived from probe networks. Surface inspection tells you whether the top inch is dry. The heatmap tells you whether the root zone is dry, which is the question that actually matters for irrigation timing and tillage decisions. Variable-rate irrigation prescriptions become legible at the zone level rather than the field average.
Pest and disease hotspots combine two layers — the historical record of where infestations occurred in prior seasons, and current AI image-recognition flags from drone or smartphone imagery. The Plant Vision case described by Visartech (vendor source) uses wearables to display plant health and temperature in real time, demonstrating the principle in deployed form. The decision changes from "spray the whole field as insurance" to "inspect these flagged spots and decide."
Nutrient distribution is the slowest-moving of the four layers — soil sampling cycles are seasonal, not daily — but the visualization payoff is high. According to the PMC/NIH work, AR glasses combined with UAV imagery increase the accuracy of nutrient zone identification. Color-coded nitrogen and phosphorus zones overlaid on the live field replace the wait-for-lab-results-then-build-prescription cycle with a continuously visible map.
The through-line across all four layers is worth saying directly. AR does not generate new data. It relocates existing data to the point of decision. Your probes were already producing moisture readings. Your drone imagery was already being processed. Your soil samples were already going to the lab. What changes with AR is that the operator's eyes and the sensor's data finally occupy the same field of view at the same moment. That spatial coincidence — data and decision in the same physical location — is the entire mechanism. Wageningen University Research frames this as the difference between systematic real-time information retrieval and dashboard-based interpretation. Modern farming generates more data every year; the binding constraint is no longer collection but delivery.
The farmer with AR doesn't wait until harvest to know what went wrong. The problem appears on the screen while there is still time to fix it.
Variable-Rate Application and Equipment Guidance
Application overlap and skipped patches are the most measurable waste in row-crop operations. Spray a 30-foot pass with a 5-foot overlap and you are using 17% more chemistry than the prescription called for. Skip a corner and you have an under-treated patch that will show up in the yield map five months later. According to InsightAce Analytic (vendor-flagged), AR-guided precision reduces blanket application of fertilizers and pesticides by targeting specific zones — though that source does not quantify the reduction, and you should be skeptical of any vendor that offers a single percentage figure as if it generalizes across operations.
The actual workflow of an AR-guided application pass follows five steps. Each one is concrete enough to evaluate against your current process.
- Load the application prescription. The variable-rate map — built from soil tests, prior yield maps, and current sensor data — is loaded into the augmented reality system before the operator enters the field. The prescription specifies application rates by zone, not by field average. This is the same prescription you would load into any modern rate controller; the difference is what happens to it next.
- AR overlays field boundaries and applied zones on the operator's view. Through tablet, in-cab display, or HMD, the operator sees the field divided into prescription zones, with already-treated areas color-coded. The peer-reviewed work on GPS-guided tractor systems describes treated zones rendered in green and untreated zones in their natural color, eliminating the mental tracking burden across a long day. End-of-row decisions stop being judgment calls and become visual confirmations.
- System calculates and displays variable rates in real time. As the rig crosses zone boundaries, application rate changes are pre-calculated and shown to the operator before the rate adjustment occurs. This matters because conditions on the ground occasionally diverge from the prescription — a wet spot the satellite imagery missed, a section already showing damage that justifies an override. Innovative farming at this level is not blind automation; it is a system that gives the operator the information needed to override intelligently when the field disagrees with the map.
- AR tracks completion and flags skipped patches. The overlay updates continuously, marking covered ground. End-of-row gaps, missed corners, and overlapped passes are visible immediately rather than discovered by yield map post-harvest. The cost of catching a skipped corner during the pass is one short detour. The cost of catching it from the yield map is a season of underperformance and a forensic discussion in March.
- Application data syncs back to the farm management system. The actual applied rates, timestamps, and coverage map are recorded automatically — closing the loop between prescription and as-applied data. Next season's prescription refinement uses real coverage data rather than assumed coverage. This loop is the long-term payback engine; the savings on a single pass are modest, but the prescription quality compounds over seasons as as-applied accuracy increases.
The reason this is the section where AR pays back fastest is straightforward. Application overlap and skipped patches translate directly to dollars per acre in chemistry and seed costs. Canopy stress and pest hotspots require interpretation and follow-up; equipment coverage data is binary. Either the patch was treated or it was not. Farm technology that converts ambiguity into confirmation — built on reliable GPS positioning data — is the technology that justifies its retrofit cost in fewest seasons.

Seeing Below the Surface
The section where AR's value proposition is most defensible is the one most farmers initially overlook. Subsurface data is genuinely invisible without visualization technology, and the spatial relationship between operator position and underground feature is the entire value proposition. A dashboard in the office cannot tell you where to drop the chisel. The AR overlay does.
The sensor stack feeding subsurface AR overlays is layered. Ground-penetrating radar identifies compaction layers and lithological transitions at depth. Electrical conductivity sensors map soil texture variation across the field — heavier clay zones versus lighter sandy zones — which correlates strongly with water-holding capacity and nutrient retention. Capacitance probes track moisture at multiple depths, typically 4, 8, 12, and 24 inches, giving you a vertical profile rather than a single surface reading. Tile-line maps from drainage installation records — often hand-drawn or held in a contractor's filing cabinet — locate the buried tile that determines where you can and cannot sub-soil without catastrophic damage. None of this data is generated by AR. AR is the visualization layer. As Wageningen University Research emphasizes, the AR component must be coupled with SLAM algorithms, GPS, and the underlying sensor networks to function in agriculture; the headset alone is an expensive hat without the data pipeline.
What the operator sees is a cross-section view of the soil column at any point on the field. Compaction zones at depth render as denser bands. Water saturation appears as a colored band at the depth where it actually sits. Root zone limits, drainage tile locations, and texture transitions are all overlaid on the live ground surface as the operator walks or drives. Stand on a spot where the surface looks unremarkable, look at the screen, and see that the compaction layer sits at 14 inches here and 22 inches forty feet to the north. That granularity is unattainable from any non-spatial interface.
The decisions this changes are the ones that move the most cost. Tillage decisions become surgical: deep-rip the compacted zones only, not the whole field, which can cut tillage fuel and time by a meaningful fraction on fields with localized compaction. Drainage decisions become safer: visible tile lines on the live view prevent the kind of damage that costs thousands per incident and ruins a drainage system that took weeks to install. Irrigation timing becomes more precise: when the saturation band at depth is already full, surface application will pond, and the AR view tells you so before you start the pivot. Yield prediction refinement improves because subsurface variability — long the unexplained residual in within-field yield variation — finally has a visualizable cause. The patch that always yields 15% below the field average is the patch sitting on a 14-inch compaction layer. Once you see the layer, the patch stops being a mystery and starts being an action item.
Why does this layer justify AR adoption faster than canopy data alone? Canopy data can be reviewed on a dashboard with little loss of utility. You can look at an NDVI map in the office, decide which zones to scout, and walk those zones with a paper map in hand. The dashboard-then-field workflow is clumsy but functional. Subsurface data, by contrast, only becomes actionable when the operator is standing on the spot and can decide where to drop the chisel, where to turn the sub-soiler, where to skip the irrigation event. The spatial relationship between operator position and underground feature is precisely what AR delivers and precisely what no other interface delivers as efficiently. The peer-reviewed PMC/NIH work on AR glasses combined with UAV imagery for soil sampling makes the same structural argument: the value is in the in-field, in-context retrieval, not in the data itself.
One honest limitation belongs in this section. Ground-penetrating radar surveys are expensive and typically run at field establishment rather than seasonally. The subsurface data layer is high-value but slow-refreshing — you map a field once every several years, not every spring. AR makes the existing data usable; it does not replace the cost of acquiring it. Operations with no current subsurface data face two investments, not one: the survey work to generate the maps, and then the visualization layer to use them. Operations that already commissioned a GPR survey when they bought the ground are sitting on a high-value dataset that has been sleeping in a folder. For them, AR in agriculture is a way to wake the data up. For everyone else, the augmented reality layer is the second purchase, not the first, and budgeting honesty matters.

What lies under the soil has always shaped yield. AR simply brings the invisible into the operator's line of sight.
Turning One Expert Into Every Operator
The workforce reality of modern farming is unforgiving. Experienced operators are aging out. Seasonal labor turnover runs high enough that the training cycle restarts every spring. The cost of misdiagnosis — wrong pest ID, wrong fertilizer rate, wrong equipment fix — compounds through the season and only becomes legible at harvest. AR functions here as a knowledge-transfer layer, taking the tacit expertise of one veteran and making it accessible to every operator who points a device at the problem.
Three concrete use cases define what innovative farming at this layer looks like in practice.
Pest and disease identification on the spot. A new scout walks the field and spots leaf damage. Without AR, the scout takes a photo, sends it to the agronomist, waits for a response, and meanwhile either guesses or stalls. With AR, the scout points the device at the leaf and the system overlays comparison images, decision logic, and recommended action. The scout's identification accuracy approaches the agronomist's because the agronomist's reference library is now in the scout's field of view. The decision cycle compresses from hours to seconds, and the agronomist's time is freed for the genuinely ambiguous cases.
Equipment maintenance and repair guidance. A broken nozzle, a hydraulic line, a sensor that has stopped reporting — these are the failures that strand a rig in the field and force a phone call to the dealer. The Amazone Group case described by Visartech (vendor source) deploys AR-based maintenance instruction through SmartInstruction, allowing specialists to create field-ready repair guidance overlaid on the actual machine. A new operator can replace a broken nozzle without making the call, because the steps appear on the device pointed at the broken part.
High-complexity task walkthroughs. New irrigation system commissioning, calibrating a yield monitor, hitching unfamiliar implements — these are the tasks where the cost of doing it wrong is higher than the cost of doing it slowly. AR overlays step-by-step instructions on the actual equipment in front of the operator, which means the slow-and-correct path becomes the default rather than a luxury reserved for tasks the supervisor watched.
| Training Method | Per-Use Cost | Speed to Operator Competency | Consistency Across Operators | Available During Active Task |
|---|---|---|---|---|
| In-person specialist visit | High (travel, day rate) | Days (scheduling-bound) | High while specialist is present | No |
| Written manual | Low | Slow (operator must self-pace) | High but interpretation varies | Partial (must stop work to read) |
| Pre-recorded video | Low after production | Moderate | High | Partial (must stop work) |
| AR-guided live task overlay | Moderate (content production up-front) | Fast (in-context) | High | Yes |
The trade-off in AR in agriculture as a training layer is real and worth stating directly. AR-guided training has lower per-instance cost than flying in a specialist or running a dedicated training day, and consistency is high — every operator sees the same workflow with the same steps in the same order. The cost-shift, however, is not free. Up-front content creation is a real investment. Somebody has to record the procedures, annotate them, validate them on the actual equipment, and maintain the guidance library as machines and protocols change. Operations with high turnover and standardized workflows recover that content-creation cost fastest, because each new operator amortizes the investment further. Operations with stable senior crews and idiosyncratic equipment — older rigs, custom modifications, one-off implements — recover it more slowly or not at all. The question is not whether AR-guided training works. It does. The question is whether your specific labor pattern and equipment fleet match the cost structure of the format. The honest evaluation framework for this farm technology is operational, not technological.
One expert's experience becomes every operator's real-time guide. Consistency scales faster than hiring.
AR Readiness Audit
AR adoption fails most often not because the technology disappoints but because the prerequisites — connectivity, sensor data, device durability, and integration paths — were never audited. Run the checklist below before vendor conversations, not after. Each item is something you can answer with your existing records and a half day of internal review. The vendors will not slow down to ask these questions for you.
1. Field connectivity coverage. Audit cellular (4G/5G) and satellite coverage across all fields, not just the homestead. AR overlays requiring real-time sensor data fail in dead zones, and dead zones in rural row-crop country are common enough that this should be the first audit, not the last. Wageningen University Research emphasizes augmented reality's dependence on coupled GPS and sensor networks; the dependency is real and farm-specific. Map your coverage with a phone signal app over a full week of normal field work. Ready: consistent signal across all working fields. Not ready: dead zones in any field where AR-guided work would happen.
2. Existing sensor infrastructure. AR visualizes data your sensors already produce. List what you have: soil moisture probes, weather stations, yield monitors, drone imagery service, soil sampling history. If the answer is "very little," start with sensor investment, not AR. The visualization layer adds no value to data that does not exist. Ready: at least three of the five sensor categories above already deployed and producing data. Not ready: fewer than three, with no immediate plan to expand.
3. Equipment retrofit cost. Tractors and rigs need GPS receivers and rate controllers that can communicate with AR systems. Farm technology vendors quote the AR software readily; the retrofit cost per implement is what determines whether the system actually works on your fleet. Quote the retrofit cost per unit before quoting the AR software. Ready: fleet already running compatible GPS and rate controllers, retrofit limited to firmware. Not ready: significant hardware additions required across multiple machines.
4. Device choice for your field conditions. Tablets are cheaper with larger screens but fragile in dust and at temperature extremes. In-cab displays are durable but fixed in location, useless when the operator dismounts. Smart glasses and HMDs are hands-free but expensive and carry a learning curve. Match the device to who will use it and where. A scout walking fields needs a tablet or glasses. A sprayer operator needs an in-cab display. A maintenance technician benefits most from glasses. One device class rarely fits all roles.
5. Data ownership and portability. Read the contract before signing. Who owns the application maps, the as-applied data, the historical overlays, the imagery? If you switch vendors in three years, what comes with you? Vendor sources do not address this question — treat any vendor that cannot answer clearly as a red flag. Ready: contract specifies farmer ownership of all generated data with export rights in standard formats. Not ready: ambiguous language or vendor-platform-only formats.
6. Pilot field selection. Choose one field that combines highest variability (where AR has the most to reveal), best connectivity (so the pilot is not crippled by infrastructure), and a crop with a margin that justifies experimentation. Do not pilot on your easiest field. The easy field will not generate evidence either way. Pilot on a field where you have a real, recurring problem the AR layer should help solve — a known compaction issue, a chronic pest hotspot, a section with persistent yield variability.
7. Integration with your existing farm management software. AR outputs are only valuable if they feed back into your records. Confirm read/write integration with your FMIS before purchase. A standalone AR system whose data lives only inside the AR vendor's app is a data silo with extra steps. Ready: vendor demonstrates live integration with your specific FMIS. Not ready: integration is "on the roadmap."
8. Success metrics defined before deployment. Write down the three numbers you expect to move: input cost per acre, yield variance within field, hours of decision-making time freed. Without baseline numbers measured before the pilot starts, ROI evaluation devolves into vendor anecdote and operator impression. Measure those three numbers across the pilot field for the season before AR deployment, then measure them again across the season with AR. The difference is the answer. AR in agriculture that cannot move at least one of those three numbers in a measurable direction is not earning its place in the operation.
Most operations should adopt AR in three phases. Field monitoring first — lowest infrastructure burden, fastest visibility win, smallest retrofit cost. Equipment guidance second — higher retrofit cost but the clearest input savings, and it builds on the data infrastructure phase one established. Subsurface and training layers third — highest setup cost, highest long-term leverage, most dependent on the prior two phases working well. Skipping phases is the most common failure pattern. Operations that try to start with subsurface AR before they have basic sensor coverage end up with an expensive visualization layer and nothing to visualize. Operations that try equipment guidance before auditing connectivity end up with rigs that lose their overlay halfway through a pass. The sequence matters more than the speed.