
Benefits of Urban Farming: Growing Food, Communities, and Sustainability in Cities
Why Urban Farming Outperforms Its Square Footage — And Where It Quietly Fails
You've probably read the same recycled list of benefits of urban farming a dozen times: fresher food, greener cities, stronger communities. Those claims aren't wrong. They're just incomplete — and they collapse the moment a building manager asks what the rooftop actually saves in BTUs, or a community board wants to know whether a 1,300-plot network can move the needle on a 100,000-resident food desert. The numbers exist. Most articles just don't print them.
Consider the contrast. According to the USDA Economic Research Service, 18.8 million Americans (6.2% of the population) live in low-income census tracts with limited supermarket access. Meanwhile, a Cleveland modeling study from Grewal & Grewal (2012) found that intensively cultivating 80% of vacant lots could meet 100% of the city's fresh vegetable needs and 100% of its egg demand. That's a serious structural intervention — but only on vegetables and eggs. Calories from grains and animal protein still come from somewhere else.
This article separates measured outcomes from marketing claims. Yield economics. Water and soil systems. Heat island math. Public health effect sizes. Food sovereignty at city scale. And the documented downsides — energy intensity of vertical farms, lead contamination, green gentrification — that most coverage skips. The full benefits of urban farming are real, but they don't distribute evenly across every dimension you'd expect.
Table of Contents
- The Real Yield Math: What a 100 sq ft Urban Plot Actually Produces
- Closed-Loop Inputs: Water, Compost, and the Lead Problem in Urban Soils
- Heat Island Mitigation: When a Rooftop Farm Pays Back in BTUs
- Public Health ROI: The Measured Effects on Diet, Depression, and BMI
- Food Sovereignty and Local Economies: Where the $115M Cleveland Number Actually Comes From
- The Honest Trade-Off List: Standards, Soil Tests, and Mistakes That Sink Urban Farms
The Real Yield Math: What a 100 sq ft Urban Plot Actually Produces
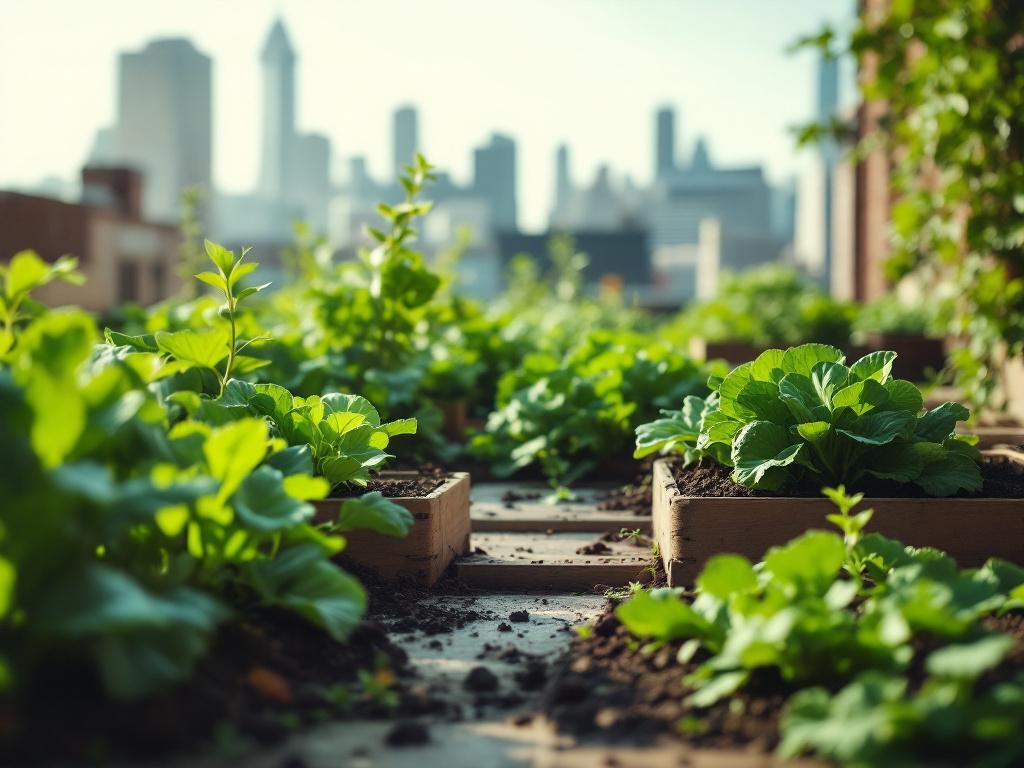
Before talking about feeding cities, you need to know what a plot actually grows. The most rigorously measured benchmark comes from Philadelphia. A 2008 harvest study tracked 1,300 plots across 68 community gardens and recorded yields directly — not modeled, not estimated. The result: approximately 2 million pounds (≈907 metric tons) of vegetables in one season, averaging 51.7 lbs (23.5 kg) per plot worth roughly $160 per plot at local retail prices (Vitiello & Nairn, U. Penn 2010).
That's the floor. The ceiling sits much higher. A well-managed 100 ft² (9.3 m²) biointensive raised bed using succession planting can produce 150–300 lbs (68–136 kg) of mixed vegetables per year — roughly 7–15 lbs/ft² (3.4–7.3 kg/m²) — according to yield tables published by Ecology Action. The gap between Philadelphia's community-plot average and a biointensive maximum is essentially a function of crop mix, soil quality, succession discipline, and operator hours.
Controlled-environment systems play a different game entirely. Open-field lettuce yields around 2–4 kg/m² per harvest (20–40 tons/ha), but hydroponic greenhouses with stacked layers and year-round cycles report up to 10–20× higher annual yield per square meter (Jensen 1999 / University of Arizona CEAC). The catch — discussed later in the climate section — is that this multiplier comes with an electricity bill that can rewrite the carbon math.
| Production System | Yield per m²/year | Labor (hrs/wk per 100 ft²) | Capital Intensity |
|---|---|---|---|
| Community plot (Philadelphia avg) | ~2.5 kg | 1–2 | Low |
| Biointensive raised bed | 3.4–7.3 kg | 1–2 | Low–Medium |
| Open-field lettuce (single crop) | 2–4 kg | N/A (mechanized) | Low |
| Hydroponic greenhouse lettuce | 20–80 kg | 3–5 | High |
Labor input is the variable most often left out of yield discussions. A 100–200 ft² (9–18 m²) plot typically requires 1–2 hours per week during the growing season for planting, weeding, watering, and harvest, after initial setup (Penn State Extension). Multiply that across a 20-week temperate growing season and you're looking at 20–40 hours of work for somewhere between 51 lbs (Philadelphia community average) and 300 lbs (intensive raised bed) of food. The per-hour productivity range is enormous and almost entirely driven by crop selection and planting discipline.

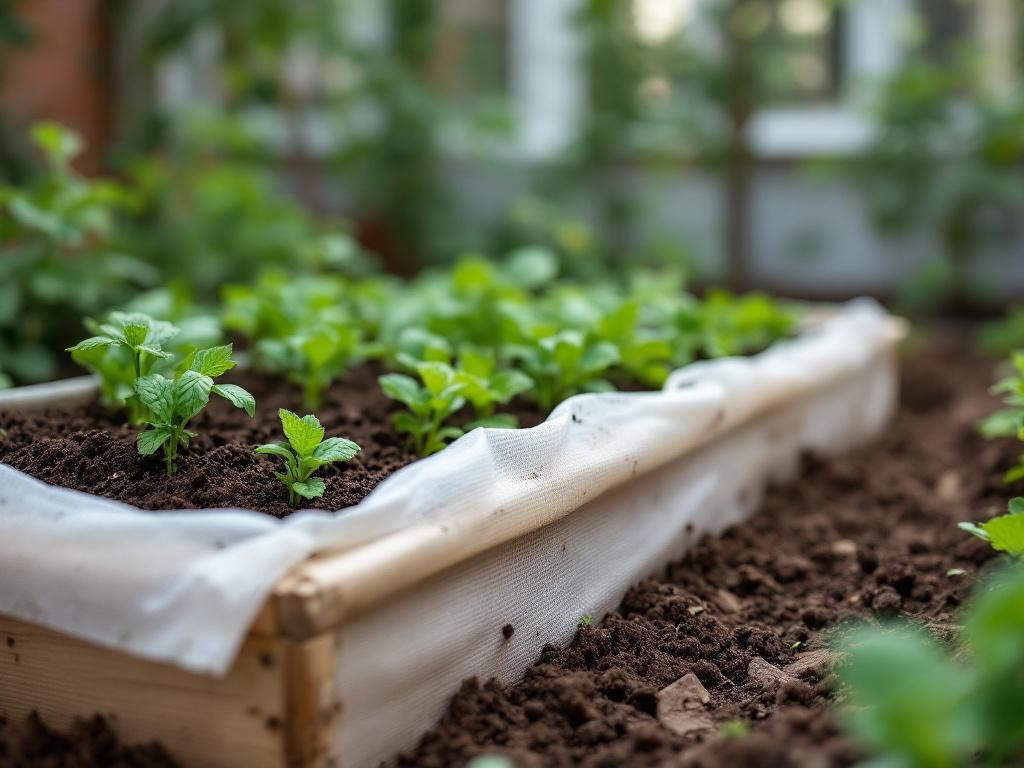
Succession planting and season extension are the two levers that separate hobby plots from productive ones. Low tunnels and simple cold frames extend the growing season by 4–8 weeks on each end in temperate climates, enabling 1–2 extra plantings of leafy greens annually (University of Maine Cooperative Extension). For an operator who already owns the bed, that's effectively free yield — no additional capital, just polyethylene and timing. Choosing the right cultivars for short-cycle, cool-season production matters more than most beginners realize, which is why a thoughtful approach to high-yield crop varieties pays back across every metric in the table above.
The takeaway: a typical community plot produces a meaningful but modest harvest. A disciplined raised bed produces 3–6× that volume on the same footprint. Controlled-environment systems produce another order of magnitude beyond that — but only on certain crops, and only when the energy ledger balances.
Closed-Loop Inputs: Water, Compost, and the Lead Problem in Urban Soils
Yield is only half the equation. The inputs side — water, compost, soil safety — is where urban farming either becomes a closed-loop asset or quietly transfers contamination from the ground into a salad bowl.
Start with water. Most vegetables need 1–1.5 inches (25–38 mm) of water per week through the growing season, which translates to roughly 62–93 gallons (235–350 liters) per week per 100 ft² bed in the absence of rainfall (University of Minnesota Extension). Over a 20-week season, that's about 1,240–1,860 gallons per bed. At municipal water rates of $5–$10 per 1,000 gallons (typical for U.S. cities), the per-bed water cost runs roughly $6–$19 annually — small for a hobbyist, but it scales fast across a community garden of 40 beds.
Closed-loop hydroponic systems shift this math dramatically. According to FAO technical documentation, hydroponics can reduce water use by up to 90–95% compared with soil-based field production of leafy greens under comparable conditions. The water savings are real and well-documented. The energy cost of running the pumps, lights, and HVAC is the offset — covered in the next section.
Closed-loop hydroponics can cut water use by 90% — but only if the electricity powering it doesn't erase the gain at the meter.
Compost is the other half of the input ledger. University of Maryland Extension guidelines recommend adding 1–2 inches (2.5–5 cm) of finished compost annually — roughly 3–6 kg/m² — to maintain fertility and soil structure. For a city, the more interesting question is where the compost comes from. Pay Drechsel of the International Water Management Institute argues that urban farming can "turn the urban waste problem into a resource opportunity" via composted organic waste and treated wastewater, provided multi-barrier standards apply (IWMI 2015). A municipal composting program feeding neighborhood farms is the textbook circular system. It also displaces methane that would otherwise vent from landfilled food waste.
Then there's the lead problem. This is the issue that responsible urban farming articles bury and irresponsible ones ignore. Reviews of urban community gardens document frequent exceedances of lead and other heavy metals in native soils, particularly in older industrial cities. Without raised beds, soil testing, or remediation, there is real exposure risk — especially for children. The U.S. EPA's Brownfields urban gardening guidance flags lead screening at 400 ppm for play areas (with higher thresholds for non-play zones) and recommends raised beds with 6–12 inches (15–30 cm) of clean soil/compost over geotextile barriers, plus maintaining soil pH between 6.5 and 7.0 to reduce metal bioavailability.
The practical mitigation stack is straightforward: test before planting, build over a barrier, source clean fill, maintain neutral pH, and add organic matter. None of these steps are expensive individually. The mistake operators make is skipping the soil test because the lot "looks fine" — visual inspection tells you nothing about a century of industrial fallout.
Water quality matters as much as soil. For urban farms using reclaimed water or greywater, the WHO Guidelines for the Safe Use of Wastewater, Excreta and Greywater in Agriculture set microbial standards of ≤1 helminth egg per liter and ≤10³–10⁴ E. coli per 100 mL for unrestricted irrigation under multi-barrier conditions. These targets exist because untreated greywater on edible crops is one of the fastest documented paths to enteric pathogen transmission. The standard is achievable with basic biofiltration and disinfection — but the operator has to know it exists before they pipe rainwater catchment into a drip line on lettuce.
The closed-loop case for urban farming is genuinely strong. You can dramatically reduce water input, recycle municipal organic waste back into productive soil, and produce food at the consumption point. But the inputs have to be audited the same way the yields are. Otherwise the system is just relocating contamination from one place to another.
Heat Island Mitigation: When a Rooftop Farm Pays Back in BTUs
The climate case for urban farming is mostly a building-envelope case. The U.S. EPA's green roof guidance reports that vegetated systems — including rooftop farms — can reduce building cooling energy use by up to 15–25% in summer and lower rooftop surface temperatures by 30–40°F (17–22°C) versus conventional roofs. At city scale, urban green spaces reduce local air temperatures by 1–3°C on hot days compared to surrounding built-up areas (EPA Heat Island Compendium).
That 15–25% summer cooling reduction is the number building owners care about. A 50,000 sq ft commercial roof with a $40,000 annual summer cooling bill recovers roughly $6,000–$10,000 per year in HVAC savings under the EPA's range — before counting any food revenue, stormwater credits, or carbon accounting. The payback timeline on the green roof installation itself depends heavily on whether the structural loading already accommodates it, but the operating math is favorable in most temperate climates.
There's a certification dimension too. LEED v4 for Building Design and Construction provides credit pathways for on-site food production — community gardens, rooftop farms, greenhouse space — toward green building certification. For developers, this isn't a soft benefit. LEED status influences leasing economics in commercial markets.
Now the counter-evidence, which most urban farming coverage skips. Not all urban agriculture delivers a climate win. An analysis by Specht et al. (2014) of multi-story vertical farms in Europe found that while land and water efficiency were high, electricity use for lighting and climate control was 2–3 orders of magnitude higher than open-field production. On coal-heavy grids, that energy input can offset or exceed the CO₂ savings from eliminating long-distance produce transport.
| Climate Metric | Low-Tech Rooftop/Lot Farm | High-Tech Vertical Farm |
|---|---|---|
| Cooling energy reduction (host building) | 15–25% summer | N/A (own load) |
| Rooftop surface temp reduction | 30–40°F | N/A |
| Local air temp reduction | 1–3°C | Minimal |
| Electricity vs. field production | Comparable | 2–3 orders of magnitude higher |
| Year-round production | Seasonal | Yes |
The honest framing: soil-based rooftop farms and vacant-lot cultivation deliver a clear climate win in almost every grid scenario. Artificially lit indoor vertical systems deliver a win only on clean grids — Quebec hydro, Pacific Northwest hydro, Nordic hydro/wind. On coal- or gas-dominant grids, they're a wash or net negative on emissions. Match the technology to the grid, or the marketing collapses on first audit.
Brooklyn Grange is the photogenic case study: 2.5+ acres of rooftop farming in New York City, supplying CSAs and restaurants while capturing meaningful stormwater volumes on impervious surfaces that would otherwise dump straight into the combined sewer. It works because it's soil-based, sun-driven, and grafted onto buildings that needed roof renovation anyway. That stack of conditions is replicable. A windowless warehouse running 18-hour LED schedules on a coal grid is a different proposition.
Public Health ROI: The Measured Effects on Diet, Depression, and BMI
Public health is the one dimension where the data on urban farming is unambiguously strong. A meta-analysis of 22 case studies on gardening interventions — many of them urban — found significant improvements in depression, anxiety, and BMI compared with non-gardening controls. The pooled effect size for depression reduction was SMD −1.28 (95% CI −1.92 to −0.64) (Soga et al., BMJ Open 2017). For context, an effect size of −1.28 is large by clinical standards — comparable to or exceeding many pharmacological depression interventions in short-term trials.
The authors describe gardening as "a useful health intervention, accessible to a large population, with few known negative side effects." That last clause is the part that separates this from most lifestyle interventions: there's no contraindication, no titration, no withdrawal profile. The cost is the price of seed packets and a place to put them.
A measured effect size of −1.28 for depression reduction places gardening in the same conversation as clinical interventions — without the side-effect profile.
Below are the four health outcomes with the strongest measurement behind them:
- Depression and anxiety reduction. The Soga 2017 meta-analysis pooled 22 studies and found large, consistent reductions in depressive symptoms across diverse populations. The mechanism stack — physical activity, exposure to natural light, soil microbiome contact, social engagement, sense of agency — is multifactorial, which is part of why the effect replicates across cohorts.
- BMI and physical activity. Gardening qualifies as moderate physical activity, and the same meta-analysis documented BMI reductions across studies. Carrying compost, watering, turning beds, and harvesting are functional movement patterns — the kind of varied load-bearing work that translates to better movement quality outside the garden, which is why anyone scaling up should also think about how farmers walk benefits translate to the daily physical demands of plot work.
- Dietary intake increase. A Denver study found that households participating in community gardens consumed 1.4 times more fruits and 1.5 times more vegetables per day than non-gardening neighbors (Litt et al., American Journal of Public Health 2011). This is a behavioral benchmark, not a yield claim — people who grow food eat more of it, and the diet change persists.
- Social connection metrics. The same Litt et al. study documented increased neighborhood social ties as a measured outcome of community gardening participation. Social isolation is now tracked as a public health risk factor with mortality implications comparable to smoking; an intervention that produces both vegetable consumption and social tie formation is structurally rare.
The structural significance of these findings becomes obvious when you overlay them on the food access map. Roughly 18.8 million Americans live in low-income tracts with limited supermarket access. In those neighborhoods, a measured 1.4–1.5× increase in fruit and vegetable consumption from community gardening isn't a hobby outcome. It's a public health intervention with a documented effect size, deployed at a fraction of the cost of any clinical alternative.
Karen Washington, the urban farmer and food justice advocate who co-founded Black Urban Growers, reframes the entire access conversation. She rejects the "food desert" label in favor of "food apartheid," arguing that the structural problem is policy, not geography. Community gardens, in her framing, "put power back into the hands of the people" by giving residents direct control over their produce supply (Guernica 2018). The depression effect size, the dietary multiplier, and the food apartheid frame all point the same direction: urban farming's health benefits aren't a side effect — they're often the primary return on investment.
Food Sovereignty and Local Economies: Where the $115M Cleveland Number Actually Comes From
The most-cited number in urban farming economics is the Cleveland $115 million figure. It comes from a specific modeling exercise, and understanding what it actually represents — and what it doesn't — is the difference between honest analysis and wishcasting.
Grewal and Grewal's 2012 study modeled what would happen if Cleveland intensively cultivated 80% of its vacant lots, plus yards and rooftops. Under that scenario, urban agriculture could produce food worth $115–115.8 million per year in retail value, meeting 100% of residents' fresh vegetable needs, 50% of fruit demand, 25% of poultry and 100% of eggs on a weight basis. Under moderate adoption scenarios, the system still met 22–48% of vegetable demand. The full citation: Grewal & Grewal, Cities 29(1), 2012.
That's a remarkable result, but read the scope carefully. Vegetables, fruit, eggs, some poultry. Not grains. Not dairy. Not red meat. Not the calorie base of the American diet. The Cleveland number describes what urban agriculture can do at maximum intensity for the produce and protein categories that scale into city-core space. It does not describe city-wide food self-sufficiency, and the original authors don't claim it does.
At global scale, FAO estimates that existing and potential urban agriculture could supply up to 10% of global vegetable production if suitable urban land — rooftops, vacant lots, peri-urban areas — were utilized for high-yield, short-cycle crops. Again: vegetables, not calories.

The caloric limitation is consistent across the literature. A spatial analysis by Clinton et al. (2018) found that even aggressive utilization of available rooftops and vacant land would primarily cover vegetable and fruit needs, contributing only a small fraction of total calorie requirements — which are dominated by grains and animal products from rural agriculture at scale. The structural reason is straightforward: wheat, corn, rice, soy, and livestock require hectares and infrastructure that don't fit on a Brooklyn rooftop. For city dwellers who want to understand what foods stay rural, the discussion of subsistence crops examples maps that boundary clearly.
Urban farms won't feed a city's calories — but they can reshape who controls the produce supply, and that's a different victory.
This is where the expert framing gets useful. Marielle Dubbeling of RUAF puts it cleanly: "Urban agriculture is not a silver bullet for city food supply, but it is a critical buffer in times of crisis and a source of income for thousands of low-income households" (RUAF briefing). Nevin Cohen at CUNY's Urban Food Policy Institute argues that urban agriculture's greatest impact is on community capacity and food justice, not just pounds produced — describing urban farms as "spaces of political organizing, skills-building, and local empowerment" (CUNY Urban Food Policy Institute). Monica White, in Freedom Farmers, frames urban agriculture as Black agrarian resistance and community self-determination — community gardens and urban farms as sites where marginalized communities "reclaim control over food production and rebuild social ties" (UNC Press).
The chain-compression argument is also real. In industrialized countries, over 40% of food loss and waste occurs at retail and consumer levels, with significant spoilage during long-distance distribution (FAO 2011). A tomato harvested and sold within a one-mile radius doesn't get a chance to spoil in a distribution warehouse or a household crisper. Localized production doesn't eliminate the consumer-level waste fraction, but it removes a meaningful slice of the distribution loss.
Now the counterpoint that almost every booster article omits. Urban agriculture projects have been documented to drive green gentrification — new green amenities contributing to rising property values and displacement of low-income residents. The classic citation is Anguelovski (2015), which examined cases where well-intentioned food justice projects became amenities for incoming higher-income residents. The mitigation isn't to avoid urban farming; it's to build the project in genuine partnership with existing community organizations, with explicit anti-displacement frameworks in the planning phase. Otherwise the food sovereignty win for one population becomes the displacement event for another.
The honest economic case: urban farming won't feed cities by itself, and credible scholars stopped claiming it would a decade ago. What it can do is generate hundreds of millions of dollars in produce value at city scale, supply meaningful fractions of vegetable demand in moderate-adoption scenarios, create income for thousands of low-income households, compress distribution waste, and — when designed with community governance — shift who controls the produce supply. That's not a marketing claim. It's a structural shift in food system architecture, even if the calorie base still comes from somewhere else.
The Honest Trade-Off List: Standards, Soil Tests, and Mistakes That Sink Urban Farms
This is the audit you run before scaling, not a feel-good summary. Each item below is a documented failure mode with a documented mitigation. Skip any of them and the project either underperforms or produces a measurable harm.
1. Test soil for lead, arsenic, and PAHs before planting. The EPA flags lead screening at 400 ppm for play areas, with higher thresholds for non-play zones. Older industrial cities show frequent exceedances in native soils. Without testing, raised beds with 6–12 inches (15–30 cm) of clean soil/compost over geotextile barriers are the minimum mitigation. Soil tests from state extension labs typically cost $15–$30 per sample — a trivial expense against the cost of growing children's vegetables in contaminated dirt. Reference: EPA Brownfields Urban Gardening Guidance.
2. Calculate your water bill before you build. A 100 ft² bed needs 62–93 gallons (235–350 L) per week in the absence of rainfall. Multiply by your local water rate × growing season weeks. For a 40-bed community garden in a city charging $8 per 1,000 gallons, that's roughly $250–$600 per season — a number that won't sink a project but that has to be in the budget before opening day. Reference: University of Minnesota Extension.
3. Match technology to your grid's carbon intensity. High-tech vertical farms use 2–3 orders of magnitude more electricity than field production for lighting and HVAC. On coal-heavy grids, the climate benefit reverses — you're producing lettuce with a carbon footprint that exceeds the transport you replaced. On clean grids (hydro, nuclear, wind-heavy), the math works. Run the grid calculation before the lease, not after. Reference: Specht et al., 2014.
4. Apply manure or raw compost on a 90–120 day pre-harvest interval. The USDA National Organic Program (7 CFR Part 205) requires 90 days for non-soil-contact crops and 120 days for soil-contact crops between raw manure application and harvest. The standard exists for pathogen safety, and it applies whether or not you're pursuing certification — E. coli doesn't check your paperwork. Reference: USDA Agricultural Marketing Service.
5. Adopt the Codex Alimentarius hygiene baseline if selling produce. The FAO/WHO Codex CXC 1-1969 sets baseline requirements for primary production of fresh produce: water quality, manure and compost management, worker hygiene, post-harvest handling, traceability. These aren't optional for retail or restaurant sales. A single pathogen incident traced to a market garden can end the operation permanently — the regulatory exposure is asymmetric.
6. Apply WHO multi-barrier standards if using reclaimed or greywater. For unrestricted irrigation, the WHO targets are ≤1 helminth egg per liter and ≤10³–10⁴ E. coli per 100 mL, plus multi-barrier protections (treatment, crop restriction, safe irrigation methods, worker hygiene). Drip irrigation under mulch is one of those barriers; spray irrigation onto leafy greens is the opposite. Reference: WHO Guidelines.
7. Plan succession planting and season extension from day one. Low tunnels and cold frames add 4–8 weeks on each end of the growing season, doubling the effective output of leafy greens. Operators who plan succession on a calendar in February produce 2–3× the harvest of operators who improvise through the season. The capital cost is minimal — polyethylene, hoops, row cover. The labor planning is the actual investment. Reference: University of Maine Cooperative Extension.
8. Audit the gentrification risk in your neighborhood before scaling visibility. Green amenities have been associated with rising property values and displacement of low-income residents in multiple documented cases. The mitigation is structural: partner with existing community organizations from the planning phase, build anti-displacement language into the project charter, and align governance with the population the project intends to serve. Otherwise the food justice win for one cohort becomes the displacement event for another. Reference: Anguelovski, 2015.
The pattern across all eight items: urban farming's benefits scale with discipline, not enthusiasm. The yields are real, the health outcomes are real, the climate gains are real on the right grid, and the food sovereignty effects are real when governance is right. None of it is automatic. The operators who treat the standards above as the starting point — not the ceiling — are the ones whose projects are still running in year ten.